Tag Archives: charts

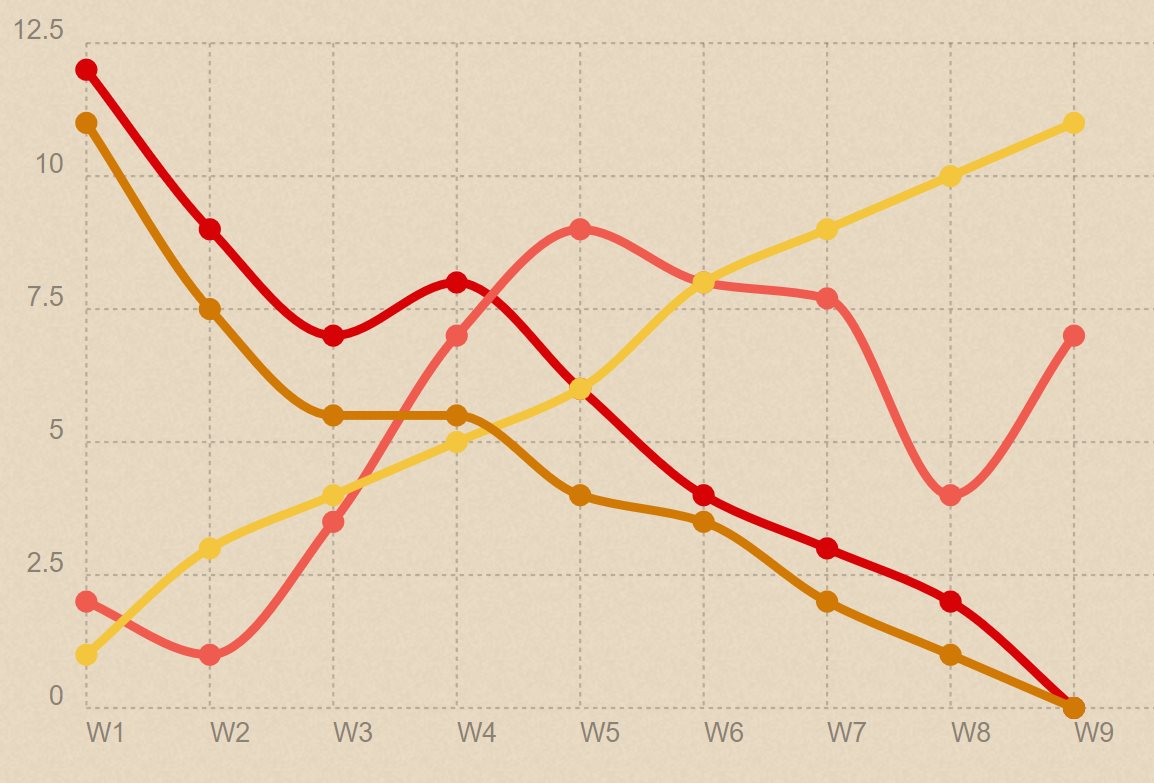
Create HTML5 Charts using Chartist JS and asp.net
After RGraph has changed their license type and I also saw an article about Chartist JS in Smashing Magazine I checked what needs to be done to move. Chartist is hosted on Github so it’s open source and also free according to their current license. I’ve already written a blog post how to Create HTML5 Charts […]

Create HTML5 Charts using ASP.net and RGraph
On an existing web project I wanted to draw some charts: bar charts, pie charts etc. I had a look at Highcharts which looks very good and has some very nice effects (like animation or putting several charts into one) but in an HTML5 book (HTML5 & CSS3 from O’Reilly) I read about RGraph. That’s […]
